


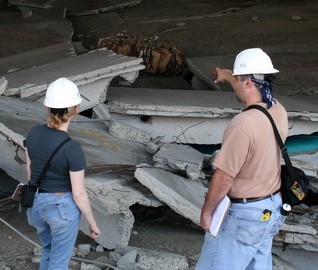


Nondestructive evaluation (NDE) describes investigative methods used to assess conditions that are not readily visible within construction elements. These techniques can be used to evaluate new or existing construction and range from basic methods like visual assessment and hammer sounding to more advanced methods like shear wave ultrasonic tomography. Applicable to concrete, steel, wood, and other construction materials, NDE techniques are utilized in quality control for new construction, troubleshooting for new or existing construction, and condition evaluation of existing construction.
In this webinar, WJE engineers and NDE practitioners Joshua White and Heather Todak summarize the basics of various NDE technologies and use project examples to illustrate the benefits of utilizing NDE to solve problems for vastly different project applications, including a newly constructed building with failing adhered tile veneer, a historic structure undergoing an adaptive reuse project, a fire-damaged reinforced concrete building, and new construction with the potential for internal concrete defects.
By the end of the webinar, you will be able to:
- Explain the basic physical principles of multiple NDE methods
- Identify applications for which NDE can be a useful problem-solving tool
- Describe instances where NDE methods may require destructive verification
- Evaluate the benefits and limitations of common NDE technologies
more to learn
View this webinar in our interactive audience console to earn 1 AIA HSW learning unit, access related resources, submit questions to the presenters, and download a certificate of completion.

Joshua White, Associate Principal and Unit Manager
LIZ PIMPER
And welcome to today's WJE Webinar, Ask the Structure: Applications of Nondestructive Evaluation. My name is Liz Pimper, and I'll be your moderator today. During the next hour, WJE Engineers and NDE practitioners, Joshua White and Heather Todak, will summarize the basics of various NDE technologies and we'll use project examples to illustrate the benefits of utilizing NDE to solve problems for different project applications. This presentation is copyrighted by Wiss, Janney, Elstner Associates. And now I will turn it over to Heather to get us started. Heather?
HEATHER TODAK
All right, thanks so much, Liz. We understand we've got a really diverse audience listening in today ranging from government and building owners to engineers and contractors. Our goal for today is to share how nondestructive evaluation can be applicable to all of those different parties, and that's in that NDE provides answers to the many different questions you may be asking about your structures.
By the end of our presentation today, we do hope that you'll be able to explain the basic physical principles of more than three NDE methods, identify applications for which NDE can be a useful problem-solving tool, describe instances where NDE methods may require destructive verification, and understand the benefits and limitations of some common NDE techniques. We've got a lot of ground to cover here. Let's go ahead and jump right in.
We've formatted our presentation today so that we'll be first reviewing some high level basics of NDE with you. And then we're going to jump into some specific techniques and how they were applied in four different project examples. We'll then wrap it up with a few closing points on the benefits of NDE and also some important limitations.
All right, I promised we'd start with the basics here. What is nondestructive evaluation or NDE? Well, to answer that question, let's first answer the question what are nondestructive tools? We're going to start here because these include some tools that we are all familiar with in other aspects of our lives or that are commonly used in other industries. Those are tools that are used to see more than what is readily visible to the untrained eye. Some examples of that: In the medical field, this includes x-rays or CT scans that you might have ordered by a doctor for diagnostic purposes. The military; they use nondestructive tools for tasks like active radar homing for missiles, even the sensing technology used by the commercial fishing industry to find fish. Many different industries apply nondestructive tools in some way. But today, we're going to be talking about the application of nondestructive tools for gaining information about construction elements.
For the purpose of our presentation today, we're going to be defining NDE as the application of those tools without causing significant or substantial effects on the test element. In our world, the test elements, those are construction materials. That can include concrete, steel, wood, masonry, terracotta, pretty much you name it. But one motto we have here at WJE is ask the structure. I'd say this phrase is actually especially fitting for us as NDE practitioners, and that's because our techniques often involve applying some sort of external stimulus and then interpreting how the structure responds to that stimulus. In a way, we are actively interrogating the building materials to answer questions for us that we have about characteristics that we just can't readily see.
What kind of questions are we talking about? Well, we get asked all sorts of questions here at WJE, and a lot of them involve NDE as the first step to answering those questions. They can range from how is this historic building constructed? To how much damage did this fire or explosion cause to my structure? Or even what caused this bridge collapse? Of course, different entities might be asking these questions from a different angle or for different reasons, but these types of questions might come from any member of the construction or the ownership team. Our goal is to provide answers that are supported by data.
Before we move on, let's sort out some of the terms you may have heard that are related to this topic. I keep using the term nondestructive evaluation or NDE, but you might be more familiar with the term nondestructive testing or NDT. Our distinction between those two is that NDT simply involves collecting information with nondestructive tools, whereas NDE involves an extra step of interpreting that data to evaluate a structure or a problem. Here at WJE, our work generally falls into the NDE category, and that's because our goal is to interpret the data to help develop answers to your questions and recommendations for moving forward.
You might also be familiar with the term structural health monitoring or SHM. The easiest way to distinguish between these two would be to ask yourself this question: Do you take the tools home with you at the end of the day? If the answer to that question is yes, we are in the camp of NDE or NDT, but if the tools stay on the structure, for instance, sensors for monitoring construction vibrations, that would fall under the umbrella of SHM. Next, I'm going to pass it over to Josh to give us a rundown of the physical principles behind some of these NDE methods.
JOSHUA WHITE
Thanks, Heather. As Heather mentioned, NDE is essentially a group of tools that helps us to see more than is readily visible to the untrained eye. These tools use basic physics like sound wave propagation to interrogate a building component and tell us more about what's happening on the inside. It can be convenient to think about these NDE tools as belonging in different buckets, if you will, based on the physical phenomena that is primarily used by the method. There's overlap between all these buckets, but it's still a convenient way to think about the various types of NDE tools that we have in our toolbox.
One of the first buckets we'll talk about is electromagnetic waves. What are electromagnetic waves? You may remember from physics classes that these waves transmit energy by the vibration of charged particles. Okay, first there's an electromagnetic disturbance or energy input, and that energy is propagated by these electric and magnetic fields. These two fields are perpendicular to each other in they're direction of the wave propagation. The interaction of these two fields is a bit complex and not really important for today's discussion. What you should know is that there are multiple types of electromagnetic waves. Visible light, for example, is an example of an electromagnetic wave, and it gives us the ability to see the ability for electricity to flow into your house through wires, the ability to use a cell phone. All of these are examples of electromagnetic waves in our lives.
The next bucket is mechanical waves. Mechanical waves, also called stress waves, are different than electromagnetic waves because they require matter in order to propagate. Energy is transmitted by particles that are vibrating and essentially colliding with each other, and they cause the next one to displace and then the next. There are many kinds of mechanical waves, and they all propagate energy just a little bit differently. The three waves that carry the most energy in the bulk materials and modern construction like building elements, we call them P waves, S waves, and R waves. The P waves have many names, but they're also called primary waves, compressional waves, or longitudinal waves. We talk to each other using P waves generated by our vibrating vocal chords. And P waves travel as shown at the top of the screen such that a particle vibrates in the direction of the wave. S waves, which are called secondary waves, sheer waves, or transverse waves, they travel as shown on the bottom of the screen where the particles vibrate 90 degrees to the direction of travel. The last of the three is the R wave or the rally wave. And it has an elliptical type motion and travels on the surface of bodies. Mechanical waves are responsible for sound as well as the vibrations that you may feel when someone, for instance, slams a door shut.
Another bucket is electric and electrochemical processes. This one is distinct from electromagnetic waves but has overlap. In this bucket, we're mostly dealing with physical chemistry and the chemical reactions that cause or is caused by movement of electrical current. These electric chemical processes are seen all over our world and are responsible for things like car batteries.
If we look at the NDE methods used in modern construction, you can see that all of these fall into the buckets I just described. Again, there's overlap between these buckets, but most of the NDE tools you may recognize are going to fit nicely into one of these buckets based on the physical phenomenon. I won't get into each of these methods, but when we look at our case studies, we'll offer a quick look at many of these. Turn it back over to Heather to go over our first case study.
HEATHER TODAK
Thanks, Josh. Yeah, so our goal today is to highlight some of the more common NDE techniques through this series of case studies. And so this first one here is a building with a failing adhered tile veneer. And it's intended to highlight the acoustic sounding and infrared thermography methods. We received a call about a residential property with two five-story buildings. The buildings were wood framed with adhered tile exterior cladding. Those tiles were large format tiles, which are definitely becoming more and more popular for both interior and exterior applications. And for this project, those tiles were directly adhered to a stucco substrate using a thin set mortar. Several tiles had actually fallen from the building over public walkways, and so the questions that were posed to us were why did this happen? And is this a widespread or a systemic problem? In other words, what they really wanted to know was is this potentially going to happen again?
Our approach to this project included the use of both acoustic sounding and infrared thermography. Let's first discuss the theory behind those two methods a little bit. Starting with acoustic sounding, this is one of the most widely used NDE techniques, but also one of the most basic. Earlier, we said that NDE often involves inputting some type of stimulus and then interpreting the structure's response. In this case, that stimulus is a mechanical impact like a hammer strike on a concrete slab. That impact produces mechanical waves in the test element. The frequency of those waves are within the acoustic range, which is generally considered to be in the range of frequencies that are detectable to the human ear. That's about 20 hertz to 20 kilohertz. Once we move above that range, then we enter into the realm of ultrasonic test methods, some of which Josh is going to discuss later.
For this method, our ear is actually the instrument that is interpreting these audible sound waves generated from the impact. Conditions like near surface delaminations or voiding, those can result in a lower frequency rattle or a hollow drumming type sound relative to a higher frequency ringing that's associated with near surface conditions. This method is really as simple as that, but honestly sometimes there's really no need to over complicate things with fancy equipment if going back to the basics can provide the answers that we're looking for.
The other method we used for this project was infrared thermography. You might also hear that referred to as IRT. This method is actually an electromagnetic method, and that's because we are measuring the infrared radiation that's emitted by the test element. This infrared radiation, that's a lower frequency than the visible light spectrum, which is why us humans cannot see it. Instead, we use a specialized camera that can measure that infrared radiation, which is then correlated to the temperature of the test element after making some assumptions regarding the objects emissivity and reflectivity. We then interpret IRT data with thermograms or color-coded photographs that show us the relative temperatures within the field of view.
How is this helpful in our practice? Well, similar to acoustic sounding, this method can also be used to find near surface voiding or delaminations. Those features are detectable because when there is a subsurface delamination, it actually acts as an insulator for the thin layer of material that's at the surface. This allows that thin layer of material to then gain and lose heat more rapidly than it's surrounding areas. Here's a quick example to illustrate that effect. CMU walls. They can have grouted or ungrouted cells. And when exposed to heat from the sun, the masonry absorbs that thermal energy. In an ungrouted cell condition, the shell of the CMU will heat more rapidly, and that's because the air inside the cell acts as a thermal break. If you time your survey correctly, this can result in really clear alternating vertical temperature bands between ungraded cells and more solid portions of the wall.
What do I mean by timing your survey correctly? Well, in order to capture those effects of that thermal lag, it's important to perform these surveys when the test element is in the process of rapidly heating or cooling. This graphic from some research we did with the Iowa DOT, it shows the radiance of a bridge deck delamination over a 20 hour period of time. The delamination is most detectable shortly after sunrise, when that delaminated material is heating more rapidly than its surroundings, and also shortly after sunset when the delamination is cooling more rapidly.
All right, back to our adhered tile veneer project and how we applied these two methods. For this project, acoustic sounding was performed first in randomly selected areas on each elevation of the two buildings to help us understand whether there might be a widespread concern. Now, depending on what you're sounding, you'll want to use different impactors. Essentially, you just want to choose an impactor that produces a clear distinction between sound areas and unsound areas. Generally, heavier impactors are going to impart a longer wavelength or a lower frequency stress wave, which then allows for deeper survey depths. For concrete slabs, chain dragging is a great choice for this because it provides more time efficient surveys over large areas. On a vertical concrete surface like a column, we might use a mason's hammer. For adhered masonry veneer, we might use an acrylic tip hammer or a rubber mallet. But for these adhered tile veneer applications, we found that using a small diameter steel sphere impactor is really ideal for detecting these unsound conditions without causing damage to the surface or cracking these tiles which can sometimes be really thin. I'm going to show you a quick video to demonstrate the effectiveness of sounding for this project. In the video, I'll start by impacting the surface in a sound area, and then we'll move into an unsound area, which you can see on the surface is hatched with a marker.
All right, as you could see or I guess hear in that video, that method can provide a really refined set of data for your sounding with the ability to identify small areas of voids even behind individual tiles. One big advantage of this method is that, depending on how refined you need to be, you can perform testing on a very tight testing grid or more time efficient surveys by spreading out those impact points. Now, this method does obviously require hands-on access to the test surface, so depending on your access conditions, it can be a little time consuming even if you do use a looser test grid.
All right, let's now look at how IRT was helpful for this project. For many of our NDE projects, it's always a good idea to apply multiple test methods to act as somewhat of a verification of our results if we get good redundancy in the findings between those two methods. In some areas where we did that acoustic sounding survey, we also used an IR camera to produce thermograms of the cladding surfaces. Due to the importance of those ambient conditions that we discussed back in the quick look, this method was most effective on east facing building elevations that had direct exposure to the sunlight and within a few hours of sunrise. On other elevations and other times of day, the differential between those surface temperatures and sound and unsound areas was just not as apparent. But where the conditions were good for IRT, like in the wall shown in these two photos here, the hotspots in the thermogram on the top, those bright yellow or white areas, those correlated really well to the unsound areas that we detected from our acoustic sounding survey. And those are hatched in the bottom photo.
Relatively speaking, the IRT survey was much less time intensive because no hands-on access is required and you can essentially perform imaging over large areas with just a single click. Both of these test methods did give us a really clear idea of where we have unsound support conditions, but what they didn't tell us is where the failure plane was located within the tile backing system so some direct verification was needed to correlate these testing results to actual physical conditions, especially when it came to answering that question of why did this fail?
For this project, verification was as simple as just removing a few tiles in sound and unsound areas. And what we found was that unsound areas did correspond to locations where the tile had fully debonded from the back buttering mortar or where there was a del laminated plane between the back buttering mortar and the mortar setting bed. As you can see pointed with an arrow in the right photo, another feature we did observe was the presence of these uncollapsed trowelled ridges. And that was considered to be a widespread condition that didn't actually present as an anomaly in either of our data sets, but could certainly be considered a more long-term durability concern. To get all of those questions answered, our NDE was supplemented with some in-situ testing to quantify the sheer bond strength of the system and also some lab testing to better understand what might've gone wrong with the mortar materials or the installation to cause these issues. The anomalies we found in our sounding did correspond with areas that had little to no sheer bond strength. In summary, for this project, NDE was a really important first step to identifying some near-term failure concerns and potential long-term concerns with this installation.
All right, I'm going to move on to our second case study now, but please, if you have any questions about that last one or these other case studies, go ahead and drop them into the Q and A box, and we'll get to those at the end. We're going to change gears here because next we're looking at a historic building that's in the early schematic design phase for a potential adaptive reuse project. And we're going to use this project to highlight an NDE technique many of you have likely seen before, and that's a ground penetrating radar or GPR.
This building was originally constructed in 1915, and it had an addition built about five years later. A unique building history, it was originally an office building and a cold storage warehouse for wholesale grocer, so some of the rooms inside were essentially ice boxes. WJE was approached to help the project team determine whether this existing structure could support the anticipated gravity loads for the new use of the structure, which did include some additional floors. Of course there were no original structural drawings whatsoever, so the as-built construction of the building was really a complete unknown. But that is our cue for using GPR.
Taking a step back to first provide some information on how this method works and then how we interpret the scans. GPR, this is another electromagnetic method, and that's because we're using an antenna that emits electromagnetic pulses that are reflected at material interfaces. For the case of a concrete structure, we send these radar waves into the concrete, and then they're reflected back to the unit when they encounter material interfaces like reinforcing steel or other embedments or internal voiding.
Essentially, the reflections occur when the waves encounter materials that have differing dielectric constants. And that's just a measure of how difficult it is to set up an electric field in that material. When two materials have a large contrast between their dielectric constants, the amplitude of that reflection is really high. A great example of that is steel and concrete. Because steel is a conductor, the dielectric constant of steel is essentially infinite compared to concrete, which is typically known to have a dielectric constant somewhere between four and 12. Now, the contrast between those two, that results in a reflection of the radar wave energy, making rebar really detectable and GPR scans.
The dielectric constant is also related to the speed that the wave travels through the material. This can vary from concrete to concrete based on factors like age and moisture content. But the speed is really important because what GPR is actually measuring for us is the time that it takes the wave to leave the antenna, be reflected off of a material interface, and then return back to the instrument. And if we know the speed at which it's traveling, then we can actually report the depth to that reflective material. To determine the wave speed, we just take scans at locations where the depth can be measured directly. We try to use existing openings whenever they're available, but sometimes this does involve some drilling to bars or taking course.
Let's take a look at some example scans to show how we interpret these signals. First, the X axis, this is simply our scan distance, and the Y axis is our two-way travel time to the reflected waves. Now, if we did go through the calibration process to determine the wave speed or even if we just take an educated guess at what the dielectric constant might be, this Y axis can show the depth. At the top of our scan are the waveforms that correspond to direct coupling at the scan surface. In the case of this scan here, we're looking at the surface of a slab on ground.
As we look deeper in the scan, you can see a series of hyperbolas that are corresponding to a layer of bars oriented perpendicular to our scan direction. The center line of that bar is at the center line of the hyperbola, and the depth of the bar or the concrete cover, that corresponds to the center of a positive reflection. In this scan, we also have a negative layer, and that's corresponding to the slab to sub-base interface. For this scan, we used a 2.6 gigahertz, which is relatively high frequency. And that was just selected to provide optimal scan resolution for a relatively shallow scan depth since the depth of this slab was only about seven inches.
Here's one more example where we're scanning from the underside of a column capital. When you use a lower frequency antenna, you can get deeper signal penetration due to the longer wavelength. In this scan here, we're able to see not only the near surface layer of steel within that column capital but also two layers of reinforcing steel in the slab above the column capital. We also detected a negative reflection that's just beyond the column capital reinforcement, and that correlated to a delamination. These two examples, they illustrate for us how GPR can be used to detect not only embedded reinforcement but also air interfaces.
All right, how did we apply this method for our historic building adaptive reuse project? Well, GPR was used to determine the typical reinforcement at beams and floor slabs and columns that we considered to be representative of the building's construction. We also used GPR to report the concrete slab thickness at each elevated level to help us determine the building's self weight. GPR was also used to detect two tiered footings that were below the basement level slab on ground and to determine the reinforcement in those foundations after a few of these foundations were excavated. And ultimately, all of this information was used to prepare as-built drawings and details that served as the basis for our gravity load analysis.
Here's a quick scan from some of our slab scanning where you can see the slab reinforcement and the bottom of the slab are easily distinguishable. For the elevated slabs, scans were collected in grid formation at each level of the building so that these contour maps could be generated to show us the slab depth like the one you see here. To report depth, we did have to determine the average radar wave speed separately for the 1915 original construction and the 1920s addition. And that was done through direct measurement of slab depth at some existing openings.
Here's an example of our as-built drawings for a typical elevated slab in the 1915 portion of the structure. The slab turned out to be a four-way slab system pretty similar to the proprietary turner mushroom slab system, if you've heard of that. That was pretty common for this construction era. To detect all of this slab reinforcement, we did have to perform scanning in both the orthogonal directions as well as on the diagonals so that we could detect it all.
This project did involve a fair number of exploratory openings, and those served us multiple purposes. One, just to directly measure the concrete cover and efforts to determine our wave speed, but also to measure the bar size and identify the bar type and collect rebar samples that we then used to test for tensile strength in our lab. Interestingly, the original portion of the building had undeformed or plain reinforcement, whereas slabs in the addition from just five years later had deformed bars. These openings were also helpful to verify our GPR findings such as that column locations like this where vertical flat bars with hooks that were used to support the spiral column ties, those needed to be distinguished from traditional round and square reinforcement bars.
GPR was an important first step for us to get a handle on how this building was constructed, but the project also involved a material strength evaluation so the concrete and steel material properties were tested in our lab. We also completed some limited petro studies to confirm whether there might be any major concerns like internal concrete distress mechanisms. You can see the differences in the concrete topping material and the aggregate size and aggregate distribution between the 1915 construction in the core on the left and the 1920s construction in the right core. We did also observe that the compressive strength between these two eras was about 20% difference between the two. The goal with these additional studies was not to make the building a whole science experiment but really just to make sure that we had our bases covered in terms of how this structure might perform for many years to come.
All of that information we gathered was considered for our gravity load analysis. We did recommend a good number of repairs to address areas of distress like these exposed beam stirrups you see here in an exterior wall. But the extent of distress really didn't justify discounting the strength of the structure, and ultimately it was determined that the existing structure was adequate to resist the gravity loads that were intended for the new design. With that, I'm going to pass it over to Josh to provide our last two case studies.
JOSHUA WHITE
Thanks, Heather. This case study is about a post-fire concrete damage assessment. And two of the primary NDE tools that we used were impact echo and ultrasonic pulse echo, or shear wave ultrasonic tomography. Okay, what happened? This is a multi-story parking garage. And as is very common for these types of parking garages, the method of construction used double tee beams. These double tee beams are precast, pre-stressed concrete structural elements. Unfortunately, a vehicle caught fire while parked and caused significant fire damage. Fortunately, no one was injured, but the owner wanted to know if these beams could be repaired.
What are we looking for after a fire event? Well, we want to know the extent of damage to structural elements to determine if their ability to carry the loads they were designed for has been compromised. For double T beams, the very important structural elements are the pre-stressing steel strands. Two main questions we have to answer are how did the fire damage... or how deep did the fire damage extend into the concrete? And is the pre-stressing steel compromised? The answer to both of these questions will allow us to determine if a repair can work here or if the beam has to be completely replaced.
Our approach to this project included a comprehensive review of construction documents such as shop drawings. These shop drawings can tell us how the beam was designed, how much pre-stressing steel is in each beam, things like that. We then performed an assessment that included visual observations and NDE. Now, for this project we actually used a bunch of NDE methods. And they all have their purpose and are all asking the structure a specific question. Heather mentioned earlier acoustic sounding, and this method can be an easy way to find the limits of what's clearly damaged concrete. It may not be able to tell you if the concrete is completely sound, but it's really easy to delineate obvious and damaged concrete.
We then used impact echo and ultrasonic pulse cycle to assess the integrity of the concrete and create a boundary of sound concrete and unsound concrete. We used GPR, which Heather also introduced earlier, to verify where the pre-stressing steel is within the WT beams and confirmed that it matched the drawings. We used all of this NDE to determine where to take concrete cores to actually measure the depth of fire damage.
Let's take a quick look at the specific NDE methods that we use for this project. The first one is impact echo. Impact echo belongs in the mechanical wave bucket. We generate energy into the concrete by impacting the surface of the concrete with a small steel sphere. We also have a sensor nearby our impactor, and we use that to receive or listen for echoes, thus the name impact echo. These mechanical waves bounce around inside the beam, and each time the waves interact with objects within the beam like steel or a crack or the opposite surface of the beam, it sends a pack of energy back to our sensor. The sensor sends the waveform to the data acquisition unit and the waveform analyzer, and then we use a fast fourier transform to turn that waveform into the frequency domain.
The frequency domain, what it does for us is if we know how fast the sound wave travels in the concrete, you can use the frequency to determine the depth of the object that caused the energy to return back to the sensor. For a piece of concrete with no damage, the dominant frequency we should see corresponds to the thickness of that concrete element. Because the sound waves are moving back and forth from the sensor to the backside of the element, it causes that frequency peak to be quite clear in an undamaged piece of concrete. If we have an object inside the concrete like a crack or even a piece of steel, we can then see a secondary frequency peak that corresponds to that object.
Here's example impact echo data. The top is a waveform as received by the sensor, and the bottom is the frequency domain. The largest peak in the frequency domain is around 6.8 kilohertz, and so if a wave traveling in this concrete moves around 13,000 feet per second, then the object that caused this reflection is about 11.5 inches deep. There are other peaks in this data as well, and you might notice this other one at 13.7 kilohertz; may not be very obvious to most people. But this corresponds to an object that's a little over five.5 Inches deep. Based on the shape and amplitude of all these peaks, we can learn something about the objects that cause them to reflect the sound wave.
I also said we were going to use ultrasonic pulse echo. What is ultrasonic pulse echo? Ultrasonic pulse echo is a general term for ultrasonic technologies that send and receive sound waves. And these usually use an array of sensors. Ultrasonic sound waves are those that are above the range of human hearing, so higher than about 20 kilohertz. Ultrasonic pulse echo is similar to impact echo except the sensors are usually created such that they attempt to generate one type of ultrasonic body wave, like a shear wave. These arrays have spring loaded dry point contact transducers, and these sensors act as both senders and receivers of the wave. One advantage this method has over impact echo is that it's merely a larger footprint of sensors, but it's still a discrete testing method that really only interrogates the concrete surface directly where you're taking the measurement. These arrays work by each sensor both sending and receiving. The first group of sensors will send out a pulse, which is received by the remaining sensors, and then the next group sends out a pulse, which is then received by the remaining sensors. And with this configuration, you have numerous travel paths that all interrogate the same conditions within the concrete. In this manner, you get a lot of redundancy in the measurements and generally more certainty about the data that's collected.
The ultrasonic shear wave tomography devices process and display data using processing algorithms that are very different than the FFT that the impact echo uses. We have four different types of scans, and they are very creatively called the A, B, C, and D scans. The A scans stand for amplitude scans, and it's simply the time signature of the received waveform. The B scan is the recreated image directly below the sensor array, and it's like a cross section of the material that you're scanning. If you create a grid and collect a series of measurements at a predetermined spacing, then you can combine them to display other slices within a 3D volume such as the C scan, which is essentially a planned view of the test area, and a D scan, which is a plan that's perpendicular to the B scan.
Here's example ultrasonic pulse echo data. On the left side of the screen, we're looking at a volume of data collected over a tight grid. And you can see that the data is represented by B, C, and D scans. If we were to look closely at a B scan directly under the instrument that we collected, we'd see that the more red something is, the more reflective it is, meaning the sound wave encountered something. The blue is essentially a lack of any signal, meaning that no signal is collected there. All right, let's go back to our case study and see how we use these methods.
We're going to use these technologies to delineate what is poor concrete and what is sound concrete. Now, based on our visual observations, we can tell what's certainly damaged. We don't need NDE for that. For this project, the fire source was directly a mid-span, so the worst observed cracking occurred here. Here's an example of the ultrasonic pulse echo scans that we took on this beam outside of what was very apparently obvious visually. The image on the left is an example of sound concrete where we have what we call a strong back wall signal. The image on the right is an example of damaged concrete taken from the same beam where we have a multitude of these signal reflectors and, really, a lack of a clear back wall signal. You might ask yourself why we get all these random signal reflectors damaged concrete. I'm going to show you why in a minute.
Here's an example of impact echo scans. The image on the left is an example of sound concrete where we have a dominant peak frequency. And this correlates to the thickness of the test element. And the image on the right is an example of damaged concrete where we have a shift in the dominant peak frequency, and then we get all these other smaller frequencies that correspond to shallow flaws. For both of these methods, we had these random signal reflectors at fire damage concrete. Why is this? Well, on the left is a sound concrete core, so there's no cracks, and on the right is a core of fire damaged concrete. And you can see both shallow and full thickness cracks that I've highlighted in red. When a sound wave passes through the sound concrete, it doesn't have any problem bouncing back and forth from one end of the concrete sample to the other, but then when you try to pass the sound wave through the damaged concrete, these cracks don't always allow the sound wave to make it back to the sensor, and it results in a weaker signal and multiple reflections that are then picked up by the NDE.
Once we've determined the boundaries of good concrete and we've collected cores from the questionable and the bad areas to understand the depth of fire damage, our main question is then looking at these cores to understand if the concrete was able to protect the steel from getting too hot or if the concrete itself was too damaged to affect compressive strength. We can determine all of this by performing a petrographic examination of the concrete cores. In summary of this case study, we're able to determine that the beam could be repaired and that the pre-stressing steel strands were adequately protected by the concrete and they were not exposed to elevated temperatures, and therefore they were not compromised. We were able to implement repairs, which consisted of replacing the damaged concrete stem with new concrete. And depending on the extended damages, however, there can be other alternatives such as epoxy injection or perhaps wrapping the beam with a fiber reinforced polymer or multiple ways of repairing these beams if, indeed, they're not too damaged.
The image on the right, by the way, is a sample of this fire damaged concrete taken by one of our photographers. And they can estimate exposure temperature by the color changes in the concrete. The color of concrete aggregates in the past may change during heating, and that depends a lot on the concrete constituents. And the color changes we see can provide an indication of the maximum exposure temperature. We can infer from this if the pre-stressing steel strands were exposed to a temperature that could be compromising to the structure.
For case study four, I'm going to show you a project in which we suspected defects within the concrete during construction. What do we have? It's a multi-story parking garage in construction. And unlike the previous case study where pre-cast, pre-stressed concrete was used, this garage used cast in place post-tension beams and slabs all supported by conventionally reinforced columns.
What's the problem? During construction, the post-tensioning stressing operations reported that for a particular beam, five of the 15 tendons, when they were tensioned to their design stress, had longer elongation than tolerated. We typically measure these tendon elongation when stressing to confirm that the stress on the strand has met the design stress. When they pull longer than anticipated, there's slack in the system. Slack in PT is not a good thing. We were told that one of the five tenant failed, but we had four that were able to sustain their design stress.
The question that the contractor had, the owner had, the engineer had, the engineer of record was is this a problem? Can we keep the beam? What is it that we're looking for? Here's a diagram of how the PT tendon profiles looked for this beam. And on the left side, you can see the tendon anchors are located in the column, and on the right side the arrows indicate that it's the live end of the tendons or the end of the tendons that are pulled. If these tendons had slack such that up to three inches of strand was able to displace more than anticipated. Now, the question is where do we think that the possible problem areas are? Certainly at the location where there's curvature, these could be susceptible to slack if the concrete was not well consolidated or had internal flaws, and certainly at the low point for the same reason. Another location of concern is at the dead end, though, where the stressing anchors are located inside the column.
The project approach involved a visual assessment as well as performing a host of NDE methods. And in interest of time, I'm not going to go over all of the NDE results but the methods that actually found the issues. Okay, let's take a quick look at these NDE methods. Ultrasonic pulse velocity, or UPV, is a mechanical wave method that uses ultrasonic stress wave similar to impact echo and ultrasonic pulse echo. What's different about UPV is that we can use two sensors, a sending and a receiving one. And we can place these anywhere on a structure individually. We transmit sound through concrete and measure the transmission time, and then we look at the overall quality of that signals that passes from one sensor to the other. The wave velocity, which is calculated by dividing that separation of the sensors by the transmission time, can be a very informative metric that's related to the concrete quality and internal defects.
We have a few ways of arranging the sensors depending on what access you have. The direct arrangement is by far the best. When defects or poor quality concrete exists between the two sensors, this shows up by affecting the transmission time and/or the amplitude of that received waveform. Depending on whether or not you can access the backside of the element, you may use a less ideal arrangement such as a semi direct transmission path or an indirect transmission path. Here's a couple of limitations and advantages of UPV. It can be a disadvantage, but one distinct advantage is that you can locate these sensors on any face of a test element, force the transducers to work in that direction. We're going to see how we use that in this case study.
Based on our observations, we found indications of consolidation related voiding at the surface of the beam, so we were also able to see how one of the strands here was unseated. This matched their reports. Our project approach included using multiple NDE methods, and all intended to answer certain questions. Acoustic sounding was looking for shallow defects, and we used these other host of methods on a relatively closely spaced test grid, particularly of the anchorage region, to look for potential defects inside the concrete. Here's the end of the beam in question. And you can see there are some live ends of strands that are for another beam that's beyond. You can see the blue test grid where we performed the NDE tests.
We're going to jump straight to the results. I'll show you the UPV results here, which are the most prominent for this project. You can look at it in terms of a contour plot. We're looking at the wave velocities. Based on the color scale on the right, lower velocities are dark brown colors and higher velocities are lighter tan colors. And this representation of the data shows that there are numerous low velocities in an area directly to the right of the tendon anchorages. This is our suspected flaw. What do we think happened? The length of the suspected flaw is consistent with those tendon elongation measurements around three inches. The data suggests that the anchors may have pulled through a void pocket kind of like this.
As I mentioned, the length of the void in that scan was consistent with those tendon elongation measurements of about three inches, so to confirm the voiding, the project team decided to drill and explore this hole. It was going to be very important to limit that drill hole depth so that we didn't impact the anchors, but what we wanted to know from this exploratory work is what's the condition of the anchor? Is the anchor pulled at a precarious angle that might compromise the strand or how it's seated or how it's engaged by the wedges? We also wanted to know the approximate size of the void so the EOR could review the column capacity. Drilling behind anchors is risky business, so this required an exploratory plan that required near surgical precision. I should mention that this was done carefully using a site-specific safety plan involving the EOR, the contractor, and the owner. This is not exactly something you want to try at home.
We were able to drill and confirm that a void was present behind the anchors, and the anchor heads appeared to be firmly seated. And we were able to confirm that the void length was consistent with those elongation records. We got these images based on drilling a 3/4 inch diameter hole into the space where we suspected the void to be and we inserted an aircraft mechanic grade borescope into the hole. We were also able to fill this void space by drilling a vent hole at the top of the void and then injecting a repair material into our drilled holes. In order to perform a little bit of a QAQC, we did perform UPV again. And I'll pose the question, do we expect to see a difference in the UPV data after we injected that void?
Well, here is a before and after the UPV plot, indicating that the areas where the void was look much, much better. As you can see, though, there's still slightly lower velocities in that same area. To answer the question I raised on the previous slide, we would actually expect to see a slight difference in the new repair material versus the old, and this is because the newer concrete hasn't had a chance to cure as long as the older concrete, so the modulus is a little bit different. With this project, however, we were very happy with the results and there was no significant indication that voiding was still present.
All right, we're going to bring this to a close with some closing thoughts. Heather and I have only talked about four project examples, but I'm hopeful that you recognize there are endless applications of NDE in the construction world. And here are just some examples of typical uses of NDE. There's a lot of examples of endless applications of NDE.
When we're trying to see the unseen and construction materials, NDE is a great place to start. It's useful for both new and existing construction, and it plays an important role in what we might call investigative engineering. We've discussed the different physical phenomena these techniques use to interrogate structures, but it's important to note that physical phenomenon is a language that these tools use. And as with any language, it's crucial that we know how to interpret the language. Our projects we review today would mostly have required some sort of verification. And this can be a very important part of NDE, but we also want to emphasize that not all projects require some sort of verification. Depending on the project needs, there are some projects that don't require verification based on our confidence with NDE.
Lastly, when we use NDE in structural applications, it's very important that engineering judgment be used to couple the NDE findings with the project implications. It's been our pleasure to speak with you today. And Heather and I will be happy to answer any questions that you may have. And to moderate that, I'm going to turn it back over to Liz.
LIZ PIMPER
Thanks, Joshua, and thanks, Heather, for the great presentation. All right, let's take our first question. Okay, back on case study one, how did you perform the shearer bond tests?
HEATHER TODAK
Well, sure. I can take that one. There is an ASTM standard for the shear bond strength testing. That's C1823. That's for shear bond strength testing of adhered dimension stones. Essentially what we're doing with that test is we're applying a load to the bottom edge of a tile and pushing up until failure is incurred or until a proof load is reached, like 50 or 100 PSI. And then after it's failed, we review the failure plane to determine where in the system was the weakest link? For instance, you might have a cohesive failure within the mortar system itself or adhesive failures at the back of the tile or at the substrate interface. For that project, we actually had some mixed results where we had multiple different failure planes.
LIZ PIMPER
Okay. Our next question, did I hear that IRT worked only on the east facade? If yes, how were the other facades evaluated?
HEATHER TODAK
Another good question. Yes, the photo I showed was from the east facade really just because the results pop the most on that facade. But we did have some success on other elevations as well. It's really the areas that are fully covered in shade for all day, so you don't really catch the sunlight on the areas, whether it's after sunrise or before sunset. In those areas, we probably would not expect very good IRT results because the temperature differential just won't be detectable enough. And so in those areas, we just stick with the acoustic sounding method. We did find that between the two methods, the results were pretty repeatable, and so you want to choose the method that provides the most effective and efficient answers in each test area.
LIZ PIMPER
Okay. Can GPR be used to detect cracks in stone, especially marble?
JOSHUA WHITE
Sure, I'll take that. We've used GPR to detect failure planes in stone and marble quite frequently and it turns out it's actually phenomenal for that application. As long as the test element is something that's large enough that you are not being affected by edge effects, what you'll find is because of the lack of all these large aggregates, you don't lose attenuation the same way you would in concrete. And so sometimes we can have extremely nice, clear visibility inside these types of elements.
LIZ PIMPER
All right, next question. Is there a limit in depth for the GPR testing?
HEATHER TODAK
I would say rather than calling it a limit, you want to just be selective about what antenna that you're using. And so we touched on this a little bit, but I can dive into it a little bit more. Generally when you are looking for deeper depths, you'll want to use a lower frequency antenna because that is associated with a longer wavelength that has less signal attenuation. And so with those antennas, you can see deeper. Generally if we're looking at concrete, we're more in the range of 2.6 gigahertz. But you can go much lower in frequency and really get into more ground penetrating radar applications where you can see upwards of 30 feet. You can be using this method to look for utilities underground and things like that as well. The compromise there is that when you go to a lower frequency, you see a reduction in your signal resolution, so generally we want to use a higher frequency in order to get really good resolution on what we are looking for if it's more near surface.
LIZ PIMPER
Okay, we've got a couple questions here relating to compressive strength for the historic Kate study. I'll run through them real quick. How has the compressive strength of the 1915 and 1920 concrete, which of those was stronger? And was the compressive strength greater in the earlier construction?
HEATHER TODAK
Oh, awesome. I'm excited that people are curious about this. To answer all those questions at once, I guess I would say the 1915 construction, the original portion of the building, did have a lower compressive strength by about 20%. I actually looked back at our results as Josh was talking, and our average for the 1915 structure was about 2,800 PSI. And for the 1920s addition, it was about 3,500 PSI.
LIZ PIMPER
Okay, next question. Can the GPR detect rebar size? I see that some areas of the slab needed to be opened. However, for beams, it's hard to assume that the reinforcement has the same size in beams.
HEATHER TODAK
Yeah. For that project example, I didn't show any photos of it, but we did do some openings in beams as well. To answer your question about rebar size, sometimes GPR can be used to estimate bar size. For instance, if we have two layers of steel that are in direct contact with each other, sometimes we can use the difference in the estimated bar depth between the two to report the diameter of the bar that's closer to the surface. We also have some other electromagnetic methods like eddy current based cover meters. That can help if you know the depth of the bar. But in most circumstances, and definitely in this case of the historic building that we were looking at, generally the best and easiest way to do it is just to do a small opening so you can get direct confirmation of the bar size and also learn some other things in terms of were these bars deformed? And if so, what kind of bar deformations are there? And we can get a lot of confidence in what the bar diameter was.
LIZ PIMPER
Okay, we've got time for about two more questions. And we are going to run about a minute past the end of the hour just so we can squeeze in a few more here. What NDT options are there for determining the depth of an existing pier?
JOSHUA WHITE
Sure, I can handle that. There's actually several methods that have been around for some time. Most likely the quickest and easiest method is called impulse response for deep foundations where... There's an ASTM standard for this where you can apply an impulse to the top of a deep foundation. And basically, you're measuring the sound waves as they travel up and down the depth of the pier. You do have to make a guess as to what the velocity of the concrete is, but this can be quite reasonable for a first guess at the depth of these foundations.
If you want to be a little bit more accurate than that, there are other methods that involve boring a hole basically adjacent to or parallel to this pier. And you got to bore a hole that's deeper than the pier. There's a couple of ways to do it, but the parallel seismic method, basically you're introducing sensors into that hole that you drill adjacent to the pier. And you're impacting the top of the pier and listening to the sound waves as it travels through the soil. And so that's a test method that involves a little bit more coordination with perhaps a geotechnical contractor, but that's another method that you can use.
LIZ PIMPER
All right, our last question. Did you examine the fire damaged concrete in thin sections to see exactly how deep the damage is?
JOSHUA WHITE
Yes, yes, we did. We collected cores in the undamaged and the damaged sections. We did a petrographic examination where they use thin sections. And then they're looking at these color paste changes as well as other factors that compare where the largest depth of damage may have occurred. And we use that and we compare it to where the steel is to determine if the steel was actually ever exposed to a heat that was large enough to compromise.
LIZ PIMPER
Okay, that is all the time that we have for questions today. Thank you, Heather and Joshua, for the great presentation. And thank you all for joining us. We hope it's been educational. Again, thank you so much for your time, and we hope you have a great rest of the day.
RELATED INFORMATION
-
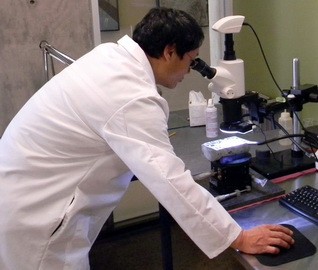
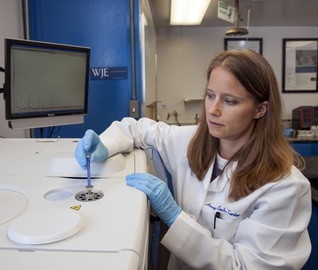
 WJE's Janney Technical Center (JTC) provides advanced testing and forensic capabilities to... MORE >Labs | Janney Technical Center
 -
 We have pioneered the use of nondestructive evaluation methods—such as ground penetrating... MORE >Services | Nondestructive Evaluation
 -
 Heather K. Todak, Senior AssociateWJE Los Angeles MORE >People | Heather K. Todak, Senior Associate
 -
 Joshua White, Associate Principal and Unit ManagerWJE Chicago MORE >People | Joshua White, Associate Principal and Unit Manager