

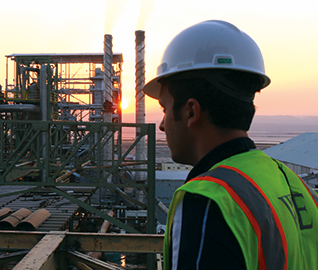
Power generation requires reliably operable equipment and a savvy producer keeping an eye on the health of their assets. For structural assets, maintenance and repairs are infrequent but financially and operationally expensive. Accurate and proactive assessment can provide significant advantages for planning effective maintenance strategies before they become emergent problems. Can you be confident that your structural assessments are recovering the right information to prevent that unwelcome outage surprise?
In this webinar, structural engineers Matt Gries and Robert Kuykendall discuss these and other concerns, aiming to equip you with insights that will help reduce outage uncertainty and enhance the reliability of your equipment.
By the end of the webinar, you will be able to:
- Identify challenges associated with assessing power generation structural assets
- Summarize common deterioration mechanisms affecting reinforced concrete structures
- Compare differences between commonly deployed assessment methodologies
- Explore the relative impacts of proactive assessment programs
more to learn
View this webinar in our interactive audience console to earn 1 AIA HSW learning unit, access related resources, submit questions to the presenters, and download a certificate of completion.
Robert D. Kuykendall, Associate Principal
Liz Pimper
Welcome to today's WJE Webinar, Keeping the Lights On: Managing Large Power Generation Assets. My name is Liz Pimper and I'll be your moderator during the next hour. Structural engineers, Matt Gries and Rob Kuykendall will discuss how accurate and proactive assessments can provide significant advantages for planning effective maintenance strategies before they become emergent problems. This presentation is copyrighted by Wiss Janney Elstner Associates and now I will turn it over to Rob to get us started. Rob.
Rob Kuykendall
Thank you Liz and thank you everyone for joining us for this discussion of the management of large power generation assets with a focus on structural condition assessments. Most of the power generated in this country today is generated through thermal means such as fossil fuel or nuclear. And accordingly our illustrations are going to come from this portion of the sector, but everything that we say today regarding condition assessments are going to be applicable across the sector no matter how the power is generated. If you need AIA credits today, your learning objectives will be to identify challenges associated with assessing power generation structural assets, summarize common deterioration mechanisms affecting reinforced concrete structures in particular to compare differences between commonly deployed assessment methodologies and to explore the relative impacts of proactive assessment programs.
We're going to accomplish those objectives by starting with an overview of asset management, discussing the distinctions of structural assets, conditions unique to power generation and the value of condition assessments. Then I'll pass it over to my colleague Matt, who will discuss condition assessments in more depth, including the common deterioration mechanisms and tools and methods available. Then I'll return for a brief summary and we'll have our question and answer period. Let's get started. So structural assets usually don't get as much attention as mechanical and electrical assets, and that could be because they are typically comparatively very durable. They tend to have a long life cycle and initially they degrade quite slowly when they're new they can perform for decades with only limited maintenance. But it's important to note that that rate of deterioration is not constant with time. You don't maintain the initially slow rate of deterioration. It increases and can increase dramatically under the right conditions. And every structural asset is unique. They do not degrade equally. Exposure and service condition variations can result in widely varying rates of deterioration from one asset to another, even if those assets are of the same date of construction. And you may have two assets that are nominally identical even with very similar environmental exposure and service conditions. Same date construction nominally the same design, but they may degrade differently due to as-built details of construction, which differ may have different concrete mixes or rebar covers.
Also, structural assets are disruptive to replace. It's not like switching out a transformer, they typically take up a lot of space. If you want to install a temporary backup system, you need a lot of space to do that and it's disruptive to the plant and it's typically preferable to repair rather than to replace these assets. Some of the factors that can result in severe exposures are listed here on this slide. Certainly the location of the plant makes a difference if you're in a harsh environment, a coastal seawater environment or if you have frequent freezing temperatures that can result in more severe exposure and your plant operational processes can result in high exposures if you have high temperatures or aggressive process chemicals. The bottom of this slide, we have a list of assets that we commonly see with severe exposure is certainly not an exclusive list. Most of these structures tend to be constructed of reinforced concrete and structures where moisture is always present like cooling towers and intake structures tend to be at the top of the list.
Let's talk about some challenges that are specific to power generation assets. Access and scale is one. In terms of access, we often have confined spaces that need to be negotiated. There may be radiological controls or in the case of a very tall structure like this natural draft cooling tower you see on the right, you may need difficult access methods to perform a hands-on assessment and scale goes hand in hand with that. If you're performing a hands-on survey of 10% of the surface of a large structure like this one, you may need a large team based on the duration of your outage and outage period is not your only challenge. Also, you have to coordinate with other outage activities that are going on. There could be a risk of the introduction of foreign materials into open systems due to your assessment activities and that needs to be planned for plant security limitations can pose challenges.
Sometimes there are portions of the plant you simply cannot visit due to security limitations and changing service conditions are a challenge. The assessment team may have to revise their assessment plan after they start due to changing service conditions. So it's important for both the consultant and the operator to be flexible. Buy-in from stakeholders is a challenge. There are typically many stakeholders in a power generation facility and the goals and objectives that they have may be different and the goals can be a moving target due to changing market conditions. So it's a challenge certainly to coordinate buy-in from all stakeholders, but important to the assessment.
Let's take a few minutes to talk about what an expected service life for a structure might look like. This graph depicts the service life of a hypothetical reinforced concrete structure whose functionality is controlled by corrosion related damage. And you can see on the vertical axis on the left, it's showing the percentage of surface area that's affected by corrosion related damage and there's an end of service limit that's been established at 20% shown by the red dash line. And that is for this generic example. The true end of service limit for any specific structure may be different, it may not be 20%. Time is shown on the horizontal axis with the origin representing the date of construction and the heavy black curve represents the deterioration of the structure Over time, if no repairs or mitigation is performed, the target service life is shown on the right and green at around 75 years. In this case, the target service life is not achieved because the deterioration curve crosses the end of service limit between 50 and 60 years. You can also see that there's initial latency period of about 20 years in which very little damage becomes visible. This is very common for concrete structures and after this point, corrosion begins and it becomes progressively more severe.
If we had selected a different controlling mechanism, say erosion or abrasion of the concrete, there may not be a latency period and the slope of the curve might be different. Or if we had selected a concrete structure with different exposure conditions than this one, the shape of the curve could be different as well. This curve just serves for our hypothetical case. So let's examine the scenario where the owner chooses to intervene in the deterioration of the structure after 30 years of age, and we'll call this repair strategy number one, which is shown in the orange dash line. It's the revised progression of deterioration of the structure after the repairs are instituted. You can see that repair strategy number one slows the rate of deterioration for a period of years, but then deterioration continues after that and this curve also does not achieve the target service life, although it does extend the service life by about a decade.
Now we consider repair strategy number two that's also implemented at about 30 years. It's shown by the blue dotted line on this graph and it does achieve the target service life. In this case, the repair strategy number two attempts to reverse or undo the damage that was present in the structure at the 30 year mark. And that's visible based on the downward vertical portion of the blue curve at the 30 year mark when the repairs are installed. So let's consider a third case where the owner is unable to install repair strategy number two, at 30 years it needs to defer those repairs for two decades to the 50 year mark and repair. Strategy number three in the pink line is shown at the 50 year mark. And you can see this repair strategy also meets the target service life, but the height of the vertical portion of the repair strategy three curve at 50 years is considerably higher than that of repair strategy two at 30 years. And the height of that curve is proportional to the effort needed to perform the repairs. So the cost and invasiveness of the repairs are considerably higher at the 50 year period.
Alright, let's change gears for a minute and talk about risk and the use of risk for resource allocation. Resources are always limited and risk is commonly used to allocate resources efficiently. Matrices similar to the one that's shown on this slide are used in many industries to quantify risk. Risk is expressed here as the product of the likelihood of occurrence of an event on the vertical axis by the consequences of that event occurring on the horizontal axis. And risk is shown in color with the lowest risk at the bottom left and green and the highest risk at the top right in red.
In my experience, operators are generally very good at assessing the consequences of any given state being exceeded, but determining the likelihood of that event being exceeded is much more difficult. When you have uncertainty, it's prudent to be conservative, but that conservatism has a cost. A conservative estimate of the likelihood can lead to an excessively high estimation of the risk and result in an inefficient allocation of your resources across many assets that you're trying to manage. So a condition assessment can provide the knowledge needed to reduce the uncertainty and drive down the risk for a better resource allocation. By better defining the likelihood of the event occurring, you may be able to postpone or even forego repairs. In some cases, knowledge is certainly power.
Another way to drive down the probability of an unexpected failure is to select an appropriate maintenance strategy. Maintenance strategies vary in a range from reactive to more proactive with run to failure on the extreme reactive end and strategic asset management on the proactive end. Now, run to failure is not appropriate for nuclear safety related structures and other critical structures, but with that exception, any of these strategies may be a best fit for your asset. Run to failure requires the least amount of knowledge of the structural condition and has the highest probability of an unexpected failure. Strategic asset management theoretically does the best job of controlling the risk of an unexpected failure, but it's intensively data-driven and is difficult to fully implement for that reason.
In general, the more proactive strategies require more knowledge of the structural condition and reduce the likelihood of an unexpected failure. There are many reasons for performing a condition assessment resulting in different classifications, some of which are shown here. And the terminology that I'm using on this slide is not universal across facilities or industries or even consultants. So you may know of these assessments by another name. The baseline assessment is performed to establish conditions for future comparison and it's usually done somewhat early in the structure's life, but not immediately after construction. You need to allow some period of time for the structure to season, you might say, to permit concrete shrinkage to occur in a large part, to experience several cycles or seasons of the year to go one to two years and also to have one or more operational cycles so that thermal conditions for your operation have been experienced by the structure.
And this way you can better distinguish between volume change related to stress, which tends to occur early on and other types of deterioration. So the information recovered is useful later in the structure's life for comparison to inform the development of conditions that are newly observed. The routine inspection is performed periodically to track the progress of conditions of deterioration and to better define when conditions first form. The more frequently you perform a routine inspection more accurately, you're able to determine when the condition forms. The nuclear industry is typically pretty good at this thanks to structural monitoring programs and repeated walk downs. And the special or in-depth inspection is typically used to answer a specific question, solve a specific problem, or to satisfy a regulatory commitment. It could be diagnostic to determine the cause of a condition of deterioration or perhaps if that cause is known to quantify the extent and the severity of the deterioration, particularly when that distress is present but is not visible. And Matt will talk more about the methodologies used to implement these assessment types. Again, the type of the assessment and the methodology used is driven by the owner's objectives.
Lemme take a short detour to talk about data maintenance and the preservation of data. Typically, the lifespan of a structural asset is many decades and often longer than the engineers who are tasked to maintain that asset. So the data must be preserved and accessible for multiple generations of employees to reference and evaluate. The advent of digital photographs about 30 years ago was a big step forward in our ability to preserve and access data. And now the advent of cloud and tablet-based data recovery systems are proving to be a further step forward. And if you haven't used tablet-based data recovery in the past, it's worth considering.
Digital data capture permits you to compare historic data and photographs in real time with current conditions and then it integrates seamlessly with a database to save you time in data processing and reporting. And the database can integrate with your asset management system if you have a digital asset management system and that will also improve your planning for future inspections. So how do you scope your condition assessment and find the right scope? Well, a condition assessment scoping process is best thought of as a collaborative process between the consultant and the operator. Consultant needs to know what the operator considers a functional failure. Is it just a percentage loss of operational efficiency? Is it a significant movement or structural displacement or some way that structure impacts another structure? Or is it when conditions become hazardous to operations and maintenance personnel or something else?
The consultant needs to know what the desired service life is. Is it 10 years or 40 years or more? And what are the operational constraints The operator needs to know what information can be recovered with the existing technologies and tools and what can't be recovered and how much time would be needed to implement the assessment and what can be accomplished during operation. The best scope of the assessment is developed by sharing information and working collaboratively. So every operator and asset is unique as we have said and should be considered that way. The condition assessment should be developed with the owner's objectives in mind. Safety is always first and foremost, but there are other objectives as well could be legal. There's certainly financial and operational objectives and the consultant is not necessarily going to be cognizant of them. And the more the consultant knows, the more help he can give you in selecting the right assessment scope, the correctly scoped assessment results in better informed decisions, reduced uncertainty and better lifecycle use of funds. Now I will pass it over to Matt to tell us a little more about the nuts and bolts of the condition assessment, Matt?
Matt Gries
Yeah, thanks Rob. And so in our experience, common stakeholder questions often involve the condition of assets now and in the future. So if we're looking for a rational roadmap for an effective condition assessment, it might look like the following first characterizing current conditions, which is answering the simple question of what do you have now and then thinking to the future, what will you have? Can we project future conditions in a way that's rational, understanding the current conditions and the estimated future conditions? We want to understand the impact of those conditions and changes in conditions. Are there problems? Are there certain limit states we need to think about? And finally, aggregating this information into a coherent and effective asset management plan, what can you do about it? So we're going to step through this roadmap together and we're going to start here with characterizing current conditions. So here we're really aiming for an accurate and relevant and understanding of the structures conditions accurate in that it correctly identifies any concerning conditions such that root cause and extent and severity is understood and relevant in that the targeted information is actionable relative to owners and stakeholder objectives.
So we're going to do this by first looking at various conditions and asset methods that are common in the power generation industry. And we're going to use reinforced concrete as the example case. But many points discussed throughout this roadmap remain relevant to other materials and other structure types. I'm having a little bit of a slide advancement issue.
Liz Pimper
Okay, we're going to wait for Matt to reconnect. So give us just one second.
Matt Gries
Okay, well, sorry for the technical difficulties there. So when we talk about characterizing current conditions, we're talking about accurate and relevant understanding of the structures condition accurate in that it correctly identifies any concerning conditions such that root cause and extent and severity is understood and relevant in that the targeted information is actionable relative to owner and stakeholder objectives. So we're going to step through both structure conditions that are common in the power generated industry and the assess methods that we use to evaluate them. And we're going to use reinforced concrete as the example case. But many points discussed throughout this roadmap remain relevant to other materials and asset types. So corrosion is very common. It impacts exposed metals and power generating facilities. And for concrete structures, things like anchor bolts and other exposed metals are relevant. But what we're talking about and what we're going to focus on is corrosion of embedded reinforcement. So when metals corrode, they expand. And when embedded reinforcement corrodes this expanding steel can cause tensile stresses on the concrete. So concrete is very strong in compression. It's relatively weak in tension. And so this expansive tenile stresses can cause cracking and distress to the concrete. It can reduce the gross section of the concrete and the concrete element and it can also reduce the effectiveness of the embedded reinforcement through reduction in steel area and lost bond like we see here in this bottom photo.
Most concrete has a naturally high pH on the order of 12 to 14, and that high alkaline environment protects the embedded reinforcement through a passive oxide layer. And there's two main sources of disruption to this passivating layer that when disrupted corrosion can initiate. The first is a reduction in pH. This is most common due to carbonation, i.e., reaction with carbon dioxide. And this can occur naturally just due to carbon dioxide in the air, but it can also occur from concentrated sources that might be present in a power generating or other process environment. Chloride ions can also disrupt the passive layer, whether they're from environmental exposure such as being situated in a coastal environment or due to water sourcing like using brackish cooling water. It's also possible that these can originate from original construction either due to admixtures or mixed water or even from the aggregates themselves.
Chemical attack is a general term describing deleterious reactions between concrete and exposed chemicals. These aggressive chemicals can include acids, bases or salts, and they commonly occur through the water that's used in power generation operations or from flue gases or other exposed airborne exposures. And we're going to talk about two different forms of chemical attack that we see in power generating environments. One is sulfate attack. And this is very complex. It takes many forms, but traditionally we think of dissolved sulfate ions that interact with cement to form expansive byproducts of gypsum and ettringite. And similar to corrosion, the expansive nature of this reaction can cause tensile stresses that results in a loss of strength, cracking of the concrete, and perhaps even spalling. Another form of chemical attack is calcium leaching or decalcification. This is a specific form of chemical attack caused by exposure to soft water or acidic conditions.
That is, when there's a pH of less than seven, this situation begins dissolving calcium-containing phases of hardened. It can dissolve rather calcium containing hardened phases of hardened concrete. And this results in a loss of strength and stiffness. So whether we're looking at chemical attack or corrosion, there are various options of prevention or repair depending on the nature and severity of the deterioration. I'm moving to the last chemical reaction that we'll talk about is alkali-aggregate reactions. It comes in a couple of different forms, but ASR, alkali-silica reaction, is most common when we have silica containing aggregates like chert. But in both cases this is generically a chemical reaction between the alkaline environment, that high pH environment of concrete and reactive aggregates. And this again can result in expansive gel that can cause cracking and loss of strength. But it's important to note here that the reaction rate and severity can vary.
Not all reactive aggregates and not all environments exposing to reactive aggregates will cause deleterious damage. And so when it comes to new structures, the regions where we have reactive aggregates are pretty well understood and there's ways to mitigate that in the mix design for a new structure or managing the moisture and surface. But we have an existing structure and it may not have necessarily been a known concern at the time of design, we're unable to reverse the damage. We might be able to slow it down by controlling moisture, but if it's heavily advanced deterioration, if it's deleterious, we may be in a situation where we're forced into full replacement.
In addition to chemical processes, there are also various physical processes that can cause material deterioration. The first type is freeze-thaw damage. This is simply water that expands when it freezes and we have water within the pore structure of the concrete. When it freezes, it expands, it causes internal tensile stresses. And over time multiple temperature cycles over time can degrade the concrete. It's worth noting that in power generating environments, including those in northern environments here in the US where they experience cold winters, a lot of elements don't necessarily experience the frequent temperature cycling due to the operating conditions and carrying warm water and things of that nature. We also have physical salt attack. So this is when dissolved salts build up and when they're on the evaporative surface of concrete, they crystallize and expand when they do so and that can result in cracking and spalling of the concrete surface and progressive loss over time.
And then finally abrasion and erosion. So many of the mechanisms that we've described can be thought of as erosive in the way that they progress and in some cases progress from the surface. But here we're actually talking about a degradation of the concrete surface from mechanical contact and this can occur from water flow, especially if there's particulates or an area of high agitation causing cavitation. And then the last point I want to make here is not really a deterioration mechanism, but when we see things like leaking staining and efflorescence, this may be visual evidence of things like a concealed condition such as corrosion staining in the left-hand image with the crack or vulnerable areas of the as-built structure. And we see this a lot where we have poor consolidation of construction joints like the cooling tower shell shown here on the right.
So these are just some of the more common deterioration mechanisms that we see in reinforced concrete structures and power generating environments. But beyond deterioration of the materials, there are other condition considerations of note. One is structural behaviors. So we need to acknowledge structural behaviors to understand the structure that we're evaluating. For example, we may need to consider settlement. And the picture I have shown here highlights the general crack pattern for a cooling tower that's experiencing some differential settlement at its basin. We also have thermal effects to consider both related to ambient and operational conditions as well as vibrations and other dynamic effects that may be caused by equipment for example. And lastly, we need to consider the question how well does the as-built structure match the design here in the states? A lot of our power generating assets are from the 1970s or 1980s and we have to acknowledge that construction practices and quality controls vary over time and by region.
And so verifying that the geometry and dimensions of the elements when we are considering the durability of a structure, the concrete coverage to the reinforcement is an important property. And shown in the example here on the screen, we're showing a distribution of cover over the height of a cooling tower. And you can see this trend and the as-built properties vary over height and in areas where there's lower cover compared to areas where there's deeper cover these deviations from the design, this impacts how we look at the structure and consider the progression of any deterioration. It's also for concrete structures reasonable to expect variability within the structure that is variability of the concrete material, especially if it's a large asset that was built over some considerable period of time. For example, we've seen structures that are 1980s vintage that have reactive aggregates and the mitigating benefits of fly ash were incorporated into design, but we might see a wide distribution of fly ash present in sampled material including areas that didn't have any evidence of fly ash. And we also have to recognize that these assets serve an operational purpose and they are intended to stay functional and operational. And so over the history of a structure, there may be a number of modifications and repairs. The extent to which those are documented might vary considerably.
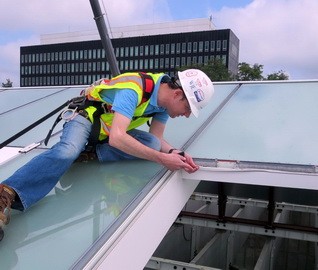
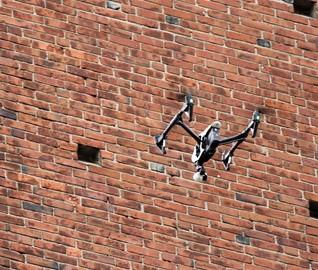
So we've talked a lot about structure conditions. Now let's look at some of the assessment methods and tools that we have to understand these conditions. First is tried and true visual survey and this is a great place to start and often a necessary place to start. And what we're talking about is identifying visually apparent conditions, whether done with the naked eye, supported by binoculars or other forms of magnification and certainly various improvements in camera systems, aerial drones, they're commonplace now and they allow us to build high resolution 2D and 3D composite images, digital twin models that give us a lot of good insight, good spatial orientation of our findings. A great way to memorialize and put into context the visual observations. Furthermore, there's rapidly developing tools that are enhancing visual surveys with things like automatic defect detection. And these are all really exciting method advancements, but they're all simply a better way to perform and memorialize the binocular survey. So they're limited to what's visibly apparent, which is often insufficient to identify root cause. And we'll illustrate this with a simple example.
So these are cracks on the same structure. I actually took both of these photos from a swing stage drop on the same concrete structure. On the left hand side we have this horizontally oriented crack on the right hand side of this vertically oriented crack. They're pretty narrow. But if we had very sophisticated visual survey tools, we might capture these with a high resolution drone for example. But what do these cracks mean? What do they mean to us as condition assessment evaluators? So in the left hand example, this horizontal crack, we made an inspection window and the first thing that we see is corroded reinforcement, relatively shallow cover. And we can see that the crack follows a direct line from the corroded steel to the surface of the concrete. So in this case, we can characterize that this crack is caused by corrosion and that might inform our expected condition of the structure moving forward or repair considerations.
This crack on the right, when we similarly make an inspection window, the first thing we notice is that there is not corroded reinforcement. The reinforcement that was revealed is UNC corroded. Furthermore, the crack is only at the surface. It maybe extends quarter inch few millimeters from the surface into the concrete. So we couple this observation with our understanding of structural behavior of this particular asset. We characterize that this is likely strain relief of flexural stresses from thermal effects. And so a crack of this nature does not need to be repaired and that's an important finding.
So the point is that visual assessment is often a good and necessary start point, but it's frequently insufficient for the accurate and relevant assessment that we're targeting, especially if we're diagnosing the condition of a structure for the first time. So then this begs the question, how do we look beyond the visually apparent I? Well building on the corrosion example and in addition to inspection windows, and I can't discount the value of a well-placed inspection window, it provides a great deal of insight. But other methods to evaluate the extent and severity of corrosion conditions include delamination surveys. You may hear hammer sounding. There's also emerging tools like advanced uses of infrared thermography that can look at infrared images over the heating and cooling diurnal cycles of a structure. And then we do have tools, non-destructive evaluation tools to measure corrosion risk. You may have heard of half cell potential as well as corrosion rate measurements that give us a point in time estimate of the corrosion rate. And it's important with these risk and rate measurements, it's important to understand and interpret these with respect to conditions such as carbonation, cover depth, moisture conditions. These can greatly impact those measurements and how we interpret them. But nonetheless, these methods provide a snapshot in time of the condition and they allow us to map these relative measures over the surface of the concrete.
I had also like to add that especially in corrosion considerations, we lean heavily on chemical analysis. For example, we would want to quantify the chloride concentrations over the depth of the concrete from the surface. And that's what we have shown here in this example, a chloride profile measured from the surface of the concrete and then kind of extending more broadly how can we see beyond that which is visually evident from the surface we have means to. Non-destructive evaluation means to measure as-built details such as thickness of an element if we only have access to one side of it, the concrete cover as we've mentioned before, but also to detect internal flaws such as internal honeycombing, voiding, planar, laminations, and maybe as well to assess the bond performance of a previous repair or modification. And when we do this, there's a variety of signal inputs that we look into or that we use to look into the concrete rather such as mechanical impulse, things like impact echo electromagnetic induction such as any current cover meters.
You may be familiar with ground penetrating radar, whether that's to evaluate cover, whether it's to evaluate thickness of an element, maybe we're looking for voiding underneath a basin slab for example. And then different forms of sound waves, whether it's through transmission ultrasonics or reflective ultrasonics. And it's really important to understand that these tools need to be used responsibly and with a sound understanding of their method theory and limitations. Analogous to the difference between going and getting an x-ray, a CT scan and an MRI. The methods are very different. What they can see are very different. So we want to make sure that we're using these tools responsibly and aligned with the targeted information that we're seeking to obtain.
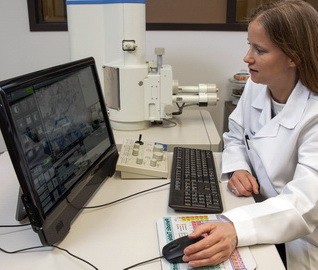
So field methods do a really good job of identifying resulting damage and extent, but when we're assessing root cause, we're often aided and improved in our approach to doing that by material sampling and testing. This allows us to do things like identify and quantify characteristics of the material. So I'm showing an example of photography here. Photography can tell us a lot about the original as-built concrete changes in that concrete and any remaining vulnerabilities in that concrete. I've mentioned analytical chemistry now allows us to identify and quantify things like chloride and sulfate contents. And I know that we're talking about reinforced concrete structures, but metallurgy similarly provides very valuable insights into characteristics and performance of metals and metal components. And lastly, physical testing. Things like testing for properties like strength, stiffness, hardness, et cetera, can really tell us a lot and inform our condition assessment.
So again, this is just a sampling of common conditions and the tools that we have to understand them. It's really important to recognize that the assessment tools are a means to an end, but they're not the end goal themselves. The data that is collected is only as useful as it is understood and put into proper context. And so with that, we have to recognize the importance of balancing the amount and quality of data and information with the relative cost and access as a major consideration when we're aligning scope of a condition assessment. So moving from capturing current conditions to how we can think about and make reasonable predictions of future conditions. And we're going to step through an illustrative example to illustrate this point. So for this example, we need to start with a baseline understanding of chloride induced corrosion. And so let's assume that at new construction we didn't batch in any chlorides, so we have chloride free concrete, but it's in an environment where there is a surface exposure to chlorides.
And over time those chlorides will diffuse from the surface exposure towards the region of lower ion concentration and they will continue to diffuse. And eventually though the chloride ions will reach the depth of the steel and when they build up insufficient concentration at the depth of the steel that can deactivate the steel and corrosion can initiate given adequate supply of oxygen and moisture, the corrosion reaction will continue. And that expansive nature of the reinforcement that we talked about earlier can cause internal cracking and if in many situations can propagate until we have surface damage revealing itself in the forms of cracking and spalling. And we see this, we observe this on real structures. These are three photos taken from the same structure that strategically positioned inspection windows such that we could capture the range of expected conditions. So now let's continue to look at this behavior on a real structure.
So this is a cooling tower, the interior surface of a cooling tower with exposure to brackish water. There's very little visual evidence of corrosion damage. In this right hand image we see a little bit of eff fluorescent staining, but there's no spalling, there's no widespread cracking. But hands-on methods like hammer sounding identified delaminations, that subsurface cracking that we're concerned about. So the image on the left here, this shows a swing stage drop about 20 feet wide and the green areas are those that were identified to be delaminated using hammer sounding techniques. And then we also used inspection windows to confirm that there is corroding a reinforcing bar with consumption of the steel area of that bar.
Now to trend this data, a repeat inspection was performed four years later and revealed a large increase in the extent of deterioration. If we look at this plot, we see the zero point, which is the time that the asset was put into service. And then we also see the subsequent back, back-to-back spaced out by four years inspections. And we can see this trend of this uptick. And so in this case, this trended condition in coordination with owner prerogatives resulted in repair actions and through the completed time of repairs, the trending conditions followed a path of increasing corrosion damage. And this is understood and expected when we understand corrosion as a mechanism. So monitoring the asset and capturing repeat data over time is a reliable means to trending conditions in support of predicting future conditions. But we also have predictive modeling tools that can supplement this type of field assessment approach.
And so for a similar cooling tower, we've taken a core through that and we've measured through analytical chemistry, the chloride at various depth. So in this case, when we look at this plot, you see the data points and then you see the black fit curve to that. And so you see at the shell exterior and at the shell interior, we have high concentrations of chlorides that due to exposure on both face and those diffuse into the concrete, but towards the center, towards the center of the shell, they're quite low. And it's helpful to compare this to corrosion initiation threshold recall. That's the point that concentration values have reached a level where the steel can depassivate and initiate corrosion and by evaluating the measured chloride concentration at the depth of the reinforcement and comparing it to this nominal chloride threshold. We know a lot about the structure now and this does help us inform what we know about the structure in the future, but we do have means to model this diffusion over time.
I should note that this animation is not from this example project, but it still illustrates the point that we can model diffusion and we can calibrate that model of diffusion to the specific structure that we're analyzing. And when we do so that allows us to predict over time the increase in chloride concentration, the change in this chloride profile over time. And so that's what we see with these green lines projecting out 10 years and 20 years from our measured data point represented by the black line. And we'll note two things about this. One is that there's an increase at the surface of increase in chloride concentrations at the surface. There's also an increase in chloride concentrations at the reinforcement. And this makes sense for two reasons. One, we're increasing the total chlorides in the structure in the system and two, over time the diffusion is going to continue and diffuse towards the center from the high concentration and high exposure at the surface.
So now we can also use these tools to evaluate repairs. So for example, let's say at the time that we measured the data represented by that black line, what if we put a barrier coating on and prevented future chlorides from entering the system? And so if we put a barrier coating on both sides of the tower, our model would show us the following. And there's a couple really interesting observations here. First is that we have a reduction in chlorides at the surface this makes sense we're no longer adding chlorides and by diffusion that higher concentration is going to lessen as the ions try to find their equilibrium point over time. But we also note that we have an increase in chloride concentration at the depth of the reinforcement. So our objective here is not necessarily to limit the total chlorides in the system, but we're concerned with the concentration of chlorides at the depth of the reinforcement.
And so this is really informative to us because if moisture and oxygen is still present, corrosion will continue. So this tells us that this may be an ineffective mitigation strategy if we extend this concept of modeling deterioration to other mechanisms. And the specific mechanisms here are not particularly important, but I'm using this to highlight that based on first principles based on judgment assumptions and the experience required, we can come up with sound scientifically driven relationships with time to make predictions for various deterioration mechanisms. In this case, the mechanism represented by the blue line has a relationship roughly in proportion to the square root of time that represented by the red line is roughly linear after some buildup period. And when we make these types of predictive relationships, we're really calibrating through two points, the zero point of new construction and the point or points in which we have data.
And so you can easily see how the accuracy of these predictions in some ways the slope of this line is greatly influenced by the accuracy of the calibration data point that we have. And you could also see that if we had additional repeated condition assessments at multiple points in time, that might improve the accuracy of this model. And with any predictive model, it's really important to make sure that we place appropriate expectations on the output accuracy and precision. This can't tell you the difference between January and April 20 years from now, right? But it still provides a rational basis to inform decision making and one that's rooted in calibrated to the actual asset that we're studying and that we're trying to manage.
So again, thinking about projecting future conditions, monitoring and observing data trends is a great place to start. It's real data, it is a measurement of your actual structure, but supplementing that there are also modeling tools that can be used to predict damage and inform repairs. It's really important again to emphasize that the accuracy of the predictions are relying on the accuracy of the input and that they should be calibrated to the specific asset in question, but they are rooted in first principle understanding and we do have to take a step back and use empirical experience to make sure that they make sense and that they're appropriate for the questions at hand. So with that, I'm going to pass it back to Rob to continue down our assessment roadmap.
Rob Kuykendall
Thank you Matt. So I'm going to quickly discuss the last two items on our roadmap with a couple of slides. That would be when the condition assessment results in conditions that may impact your target serviceability and reliability, what do you do about it and how do you best mitigate the risks through an asset management strategy? So structures are designed with a minimum target reliability that is implicit in the design standards that are used at the time. And the applicable construction tolerances and structures frequently are over-designed and they exceed that minimum reliability and therefore have a longer service life than was envisioned by the design standards. And as a manager, you can and should take advantage of that additional reliability that the structure has, deterioration of the structure reduces the reliability. Another way of saying that is that it increases your risk and an asset's condition presents a problem when its target limit state is exceeded or is predicted to be exceeded before the end of the target service life. It is to say when risk exceeds your risk tolerance. And of course risk tolerance varies by owner and asset.
A word on management strategies. How best do we mitigate risk? And we've said it many times in this presentation and we can't emphasize it enough that the importance of aligning your management strategy with the owner's objectives, the objectives drive what your actions should be. Do you only need to ride out a structure to its retirement at your date that you've selected your target service life, you're effectively creeping across the finish line, or do you need to sprint across the finish line? Do you want to be ready to extend your license through license renewal for another 20 years at that target service life? Those are very different objectives and result in very different asset management paths.
The remediation that you might take could be as simple as monitoring a structure repeatedly or hazard mitigation in which you reduce the operational demands on the structure to keep it in service for longer or it could go all the way to repairs and strengthening. So the roadmap that Matt presented is simple in concept, but it's powerful and informative if it's, well, let's summarize what we talked about today. Better understanding of the condition of a structure reduces your risk knowledge is your friend developing the right condition. Assessment is a collaborative process between the consultant and the operator. The consultant should be independent and should inform but not dictate the management strategy. There are powerful assessment techniques both in the field and in the laboratory that are available, but each has its limitations that must be considered and timely repairs can reduce overall lifecycle costs. Generally the earlier you act, the greater your savings can be. That concludes our presentation, so I will pass it over to Liz to facilitate our question and answer period.
Liz Pimper
All right, thanks Rob and thank you Matt, and thank you all for hanging in with us during our connection issues today. We apologize about the interruption. We did run a couple minutes over time, so we plan to extend a few minutes past the end of the hour to answer your questions. Okay, let's take our first question. Would you encourage the use of fiberglass or carbon fiber reinforcing bars in repairs?
Rob Kuykendall
I can take that Matt. Sure thing. Well, certainly there can be some instances when you want to use fiberglass or carbon fiber because they are not corrosive. Although carbon, if it's in contact with steel reinforcing bars can result in a corrosion cell, but reinforced fiber polymers generally are not ductile and they're strong but brittle. And so if ductility is an important aspect of your design, you should consider sticking with steel either in epoxy coated reinforcing bars or galvanized reinforcing bars.
Liz Pimper
Okay. Our next question, based on your experience, what should be included for new designs to delay the initial corrosion and reinforcing?
Matt Gries
Yeah, I'll take that one Rob. And we help a lot of different clients out with things like mix design and durability consulting to answer questions just like this. There's a lot of different ways that we have control here. One is with the mix design itself, trying to produce a mix that is fairly resistant to the diffusion of chlorides. We also can use reinforcements reinforcing steel that has corrosion resistant properties. For example, epoxy coated reinforcements, a well-established type of reinforcement now, and there's other emerging materials and products that exist today. We also can increase the cover. You can consider things like barrier coatings, ways that can limit the opportunity for chlorides and for moisture to penetrate the concrete. So there's a number of different ways in new designs to delay corrosion to delay the penetration of chlorides to limit the availability of moisture that's necessary to drive that corrosion reaction. So whether we're looking at the material, whether we're looking the concrete material, the reinforcing material, or whether we're looking at some of the dimensions of the cover, for example, or whether we're looking at things like coatings, a lot of different options there.
Liz Pimper
Okay. Our next question, which methods are used for measuring corrosion depth or pitting damage? And what is the tentative remaining life of the structure after repair?
Rob Kuykendall
I can talk about that, Matt. Sure. So to measure the quantity of corrosion, you really need to physically access the reinforcing bar. And unless you've been monitoring it from its inception monitoring the current in the bar from its construction, you won't know what your degree of section loss or you can't know what that will be. You need to physically access the reinforcing bar, clean off the corrosion product and then measure it using calipers or you can measure pitting using. There are little gauges that are frequently used in weld inspection called a pit gauge. It's very helpful in measuring pitting, but you have to measure those physically.
Liz Pimper
Okay. Next question. What is the typical acceptable section loss in terms of percentage of steel structural members?
Matt Gries
Yeah, I'll take a first swing at that. I mean the answer to a lot of these questions are going to be, it depends, and that's one of the main points here, right? Is that condition assessments are not just a blanket set of standards that you can apply to any and all structures in any and all conditions. But in general, we often in the field might use 10% or 15% of the steel area, meaning 10 to 15% reduction area as a threshold to consider things like supplementing that reinforcement if we're in a repair situation.
Rob Kuykendall
And I would add, Matt, that it's important to remember that the structure may have been over-designed. And so it's possible that you could have even a greater loss in percentage of area of your steel and not need to supplement it, but it would require a structural analysis to determine what your degree of overdesign is.
Liz Pimper
Okay. I'm going to take a stab at reading this next question correctly. So if you guys can look at your screens too, make sure I'm reading it right. How do you obtain the chloride concentration in the unit of PPM by mass from percentage of the weight of concrete?
Matt Gries
Yeah, so I'll take that one. By percent of weight of concrete is what we actually measure in the lab, whether we're doing acid soluble or water soluble, the corrosion thresholds. And a lot of the research that underpins that are based on chloride concentrations as a percent of cement content within the concrete. So the percent of mass by weight of concrete, that's physical measurement in the laboratory, the comparison to chloride thresholds that requires a conversion, making an assumption or an estimate of the amount of cement contained within the concrete that we're looking at. So a lot of the thresholds are benchmarked against as percent weight of cement, but the actual direct lab measurement is concentration by weight of mass of sample, i.e., concrete.
Liz Pimper
Okay. How does recycled water impact the performance of structures?
Matt Gries
Yeah, Rob, I'll take a first swing at this one too. And if you want to add to it, so I've started here from folks around the industry that a lot of considerations to recycling water and a lot of questions are being asked around how does that impact mechanical equipment? Things like pumps, things like filters. But I haven't heard a lot of people asking about how it impacts the performance of structures. And when we think about increased concentrations of different chemicals, when we think about increase in particulates or suspended solids, that will change the performance or may change the performance of concrete structures, for example. So this is a really good question and it's one that in a condition assessment, we definitely want to understand if there's been changes in the chemistry or otherwise, if there's been changes in the type or nature of say the process water that will inform both the history of the structure to date and be informative in terms of what we might expect in the future. So this is a really good question from that standpoint that we're hearing about a lot of recycled water, it remains to be seen what those changes actually look like, but it's an important question to ask.
Liz Pimper
Okay, I've got time for one more question. For the service life estimate, is it quantitative or qualitative?
Matt Gries
Well, it depends. And when we say service life estimate, that's a pretty generic term. And the amount of information on which you're making that estimate can vary considerably. You can make a service life estimate from a visual assessment. It might not be very accurate. In fact, it's almost guaranteed to probably not be very accurate if there's conditions of note. But running from kind of over a range of information, both the quality of that information and the quantity of that information will vary the degree to which it is quantitative. But I think it is important, and we noted in the presentation that you have to take these predictions with a grain of salt. It might not satisfy your financial modeler who's working on a year by year basis or quarterly by quarterly basis. But nonetheless, it's valuable information to understand the direction and trend of your structure and with a calibrated estimate to your structure. But it's going to vary and very highly on the type and quality of the information that you have.
Liz Pimper
Great. Thanks Matt. And thanks Rob. Unfortunately, that is all the time that we have for questions today. So again, thank you so much for your time and we hope you have a great rest of day.
RELATED INFORMATION
-
Matthew B. Gries, Associate Principal and Janney Technical Center Regional DirectorWJE Northbrook MORE >People | Matthew B. Gries, Associate Principal and Janney Technical Center Regional Director -
Robert D. Kuykendall, Associate PrincipalWJE Atlanta MORE >People | Robert D. Kuykendall, Associate Principal -
MORE >Markets | Power Generation -
We engage a full suite of state-of-the-art instrumentation and monitoring capabilities to test... MORE >Services | Instrumentation and Monitoring